

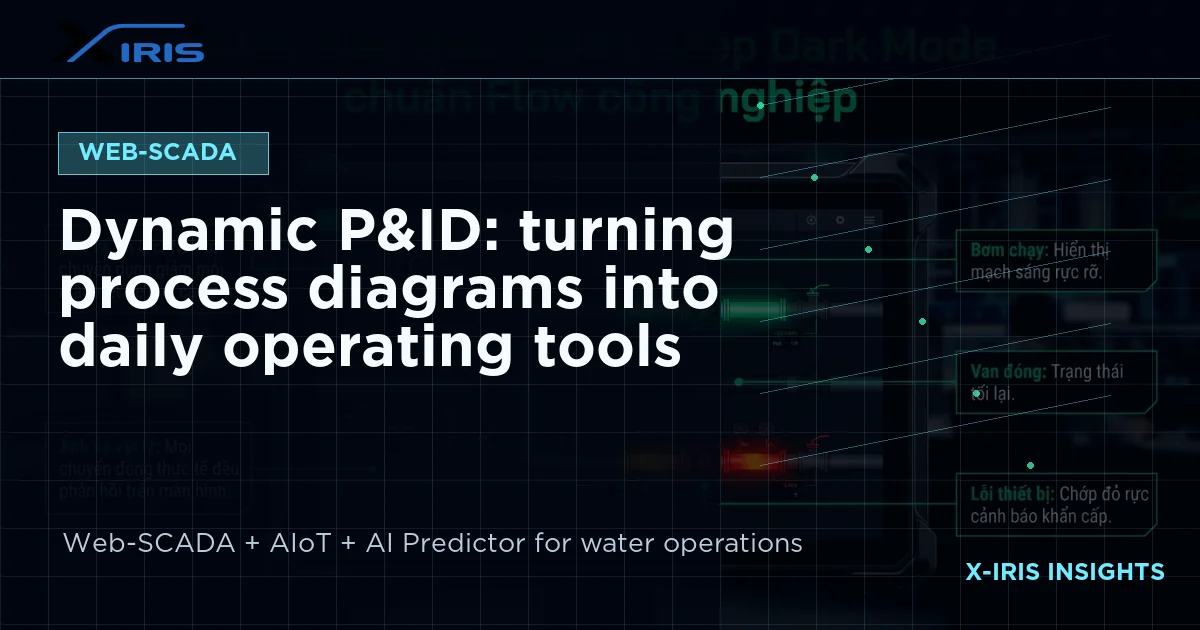
Dynamic P&ID connects process drawings with live equipment status so operators can understand location, cause and impact faster.
Why this topic matters
See how dynamic P&ID improves daily water treatment operations by linking process diagrams, equipment status, alarms and operating history. In many plants, the technical challenge is not the absence of equipment; it is the gap between field signals, operating context and management decisions. When data becomes visible, trusted and traceable, the team can improve performance without relying only on end-of-shift reports.
Key signals to monitor
- Map each pump, valve and tank to a live SCADA tag.
- Highlight abnormal equipment in the process location where it occurs.
- Attach alarm history and operator notes to the same process view.
Implementation approach
Start with a focused operating objective, then map the data that supports that objective. A plant should define signal ownership, dashboard roles, alarm severity and report formats before expanding into more advanced analytics. This keeps the project practical for operators and easier to defend for managers.
How X-IRIS supports this workflow
X-IRIS combines Web-SCADA, AIoT data collection, AI Predictor and reporting in one operating layer. The platform helps teams monitor real-time conditions, respond earlier, keep evidence for audits and build a data foundation that can scale from basic supervision to deeper optimization.
For web-scada foundations, the most valuable starting point is usually a short survey of existing PLC signals, measuring points, reporting duties and cost drivers. From there, the roadmap can be phased so the plant gains value early while preparing for long-term AI-assisted operations.


